
What is good data in the context of IoT-based analytics in manufacturing? The answer depends somewhat on the use case and the individual expert. But as in sports, one should start from the basics:
- Data exists, is relevant and is collected with high enough frequency.
- Data is traceable: when, where, and how it was generated.
- Data is in a form that renders itself to analytics.
These are general properties that apply to all kinds of analytics. Here, I discuss each from the narrow perspective of my experience working on manufacturing-related IoT projects with large datasets.
Data existence
Data should exist so analytics can be made with it. This is an obvious fact, but it is very common for management to want new analysis to support the business and not have the data required.
A brute force approach would be to collect as much data as possible from the manufacturing process without considering the actual use cases too much beforehand. This leads to increased running and storing costs, which are not a huge problem nowadays as storage and computing are becoming cheaper. In this line of thinking, the development costs and delivering on time are more critical factors that should be considered. Billing hours of an expert workforce are expensive and the benefits of being first on the market cannot be underestimated.
As life is complicated, there are a couple of counter arguments:
Even though computing and storage are cheap, they are not free. Like vapour fills all space, storage and computing use increases easily to fill limits set by the economy or technology.
From a sustainability standpoint, less is better. Moving, storing, and analysing data requires energy, which creates emissions. This is not good for our planet.
Another point is the kind of programmer laziness that comes with scalable computing. The incentive to create efficient and lean (elegant, in my opinion) code decreases when one can use brute force. This leads to bad PoC code that is so heavy to use in production that even the cloud brute force is not enough to achieve the set goals, and/or the costs go through the roof.
A balance between a get-things-done mentality and endless polishing towards elegant solutions is good goal to aim for.
One way of achieving this is to make the addition of new data so easy that it can be done later when the need arises. This ties to the scalability and robustness of the Analytics applications and their data pipes. Data collection from IoT sources requires hardware expertise, sensor installations and machine experts, so it is the software side of things that should be designed well, i.e. that it is an effortless task to add new signal or measurements into the application.
When doing specifications for a new analytics platform or the whole data-gathering process, think about what information is required as the logical minimum to solve the possible problems the business is interested in. Here is a small list of minimum variables to start with:
- Time of measurement.
- Process part or location.
- Sampling frequency. It should be high enough to fulfil the requirements. For example, measuring a machine part that moves fast requires a high measuring frequency.
- What is measured.
Data traceability
Industry manufacturing processes are very complex, and the data pipelines themselves add another layer of complexity.
A real-life simplified * example of the data’s end-to-end journey from industry device to the application user from a project that I have worked on:
- IoT sensors measure some values based on their configuration.
- Measuring PC handles the initial IoT signals and saves them to files in a specific format.
- Files are sent to clients' Azure cloud.
- Files are copied to our AWS cloud.
- Data is parsed from array files and stored in Data Warehouse or DW tables.
- In DW, data is transformed, and metadata is added.
- Data is read by the analysis backend, which calculates some KPIs, etc., and then those KPIs are stored in DW.
- Then UI backend reads the data, does some cleaning and stores it into a cache.
- UI shows the data and the calculated KPIs to the end user.
In the example, there are nine steps in which data is touched or handled somehow. Each of these steps has the possibility of containing a bug or error, as we live in the real world where entropy increases without extra effort. The more steps there are, the more chances for something to fail.
Calculated results are not strictly speaking part of the original data, but they should synchronize with it to provide useful insights, so I added that step to the example.
Some concrete reasons are that the data is different from previously assumed, as there are usually high-variance industry devices, and the logic of some steps works differently than prior experience would suggest.
Then there are human factors, like different parts of the organization being responsible for different steps, so there are discontinuities in information. Sometimes, even the vocabulary differs between technical experts, like hardware engineers vs. developers.
It is easy to see how crucial it is to have the data be as traceable as possible when fixing anomalies noticed at the user's end of the pipeline.
In practice, this means that there should be metadata describing how, when, and where the data was collected, updated, transformed at each step, etc.
Logging is rarely done too much. Quite often, my own new commits just contain some new logging that hopefully may shed light on some annoying problem that has plagued the project for weeks. The next commit is more logging as the previous was not enough.
*These steps contain several smaller sub-steps
Data Format
IoT application data is usually some value measured by the IoT sensor at the time of measurement, so when building data applications, we are, in practice, dealing with time series.
Some common practical issues with IoT data representation are:
- Boolean values. I have encountered real-life examples where Boolean values are represented by 0/1 integers (my preference in analysis code), or "True", "False", or "TRUE"/" FALSE" strings depending on the source system. For analysis a common universally used notation is a must.
- Unit conversions. For example, in the paper industry, the standard unit for running speed is m/min for paper machines running. Good luck calculating accelerations and other physics stuff with that: some errors will be encountered! SI units should, in my opinion, always be used in the analyses. Conversion to other units should happen only before presentation.
- Time stamps. If the sites from which data is produced are scattered around the globe, time zones will also be a common headache. UTC time should be used whenever possible. This is also important from the tractability point of view. Trying to match analysis results with uncertainty regarding which time the results has happened causes a headache for which ChatGPT does not offer medication.
All the points above have caused a lot of friction and unnecessary issues when analytics are implemented in production.
A way to solve these problems is to build an "analysis" layer in the data warehouse where data follows strict requirements for its form and representation. The details of this layer should be planned by Data engineers together with the analysts/DS, i.e. the people working with the actual use cases. The layer would remove the need of deciding case by case which data polishing steps should be done at the data pipe vs. application/analysis level. It would be the DE department's job to make the data transform from raw data to the analysis layer and then the analysist job to transform the analysis data to results.
Let’s continue assuming that all the boring data quality issues above have been solved and an analysis starts to work with the data.
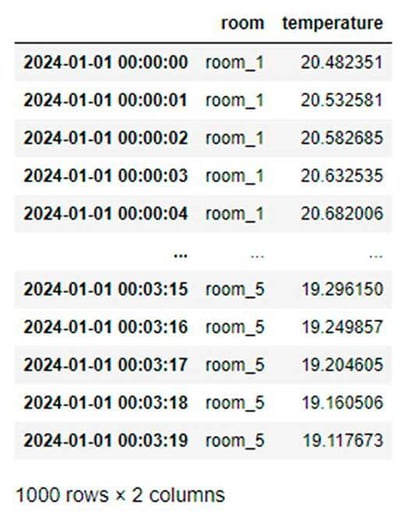
With time series data, a natural format is the “wide” format, where each column represents a measured quantity, and each row represents a single measurement. In concrete terms, think of Excel, where you have the temperature for different rooms of your house organized so that each column is a room, and each row is the measurement time (example image).
 This format is nice for humans to look at and straightforwardly analyze, for example, with Python's different data analysis packages. Incidentally, this is like the tabular format in which ML algorithms usually digest their training data.
However, the "long" format is usually used when data is warehoused in a database. In long format, we would have columns for room, temperature, and time and observations for each room would be stacked on top of each other.
The reason for this is that the long format is denser and scalable. If a new variable is introduced, there is no need to add a new column for it, as would be the case with the wide format. Theoretically, it is easy to change the format from long to wide, for example, with Pandas .pivot() or .pivot_table() method. These methods are also implemented in Snowpark if Snowflake is in use.
The example above was an idealized way of describing how data looks. In real life, it’s a little more complex. Real measuring devices have memory and sampling rate limitations, i.e., which frequency measurements are taken. Also, the sampling rates of different sensors may differ. One signal is measured every second, another one every 5 seconds, for example.
Suppose the data collection rate is high and there are many signals. In that case, the signals do not fit the measurement PC’s memory at the same time, leading to slight differences in the measuring times and different signals being measured out of sync.
Let’s imagine our building is an inherited mansion with hundreds of rooms, each with its own thermometer sensor and a moisture sensor. Moisture is measured every 5 seconds, and temperature is measured every second. The data is sent from the collector PC to the data warehouse, where it is stored in a long format. Now, we load a piece of the data into our local environment and want to do some data analysis based on it.
After pivoting to a wide format, this more realistic example looks like this: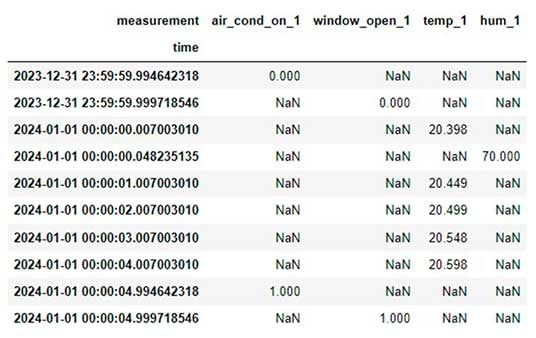
Now, we can proceed to do further cleaning for different columns like nan interpolation, resampling, etc., but these steps require the use of case-specific knowledge to make them correctly. Bit like values cannot for example be aggregated with mean() as it results in values other than 0 or 1. After doing some data polishing tricks we get a workable data set.
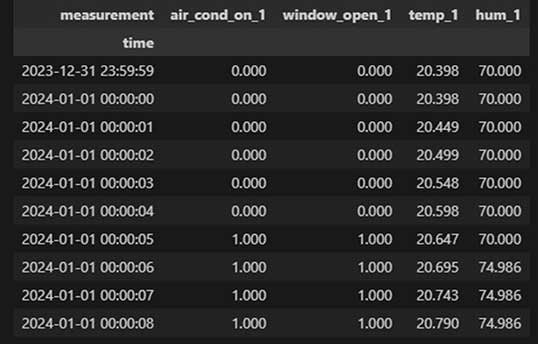
(This figure looks different as I have recently started to work exclusively with VS codes interactive shells.)
Now the data is in a format that can be used as training material for ML-model. We could, for example, make a prediction of room humidity based on temperature, air conditioning, and window status.
Summary
Transforming IoT data, which contains tens of thousands of signals, into real business value is a complex process that requires expertise to be successful. The key elements are existence, traceability, and quality of the data. These issues are best solved with seamless collaboration of business stakeholders, Data Engineers, and Data Analysts. Stakeholders defined the KPI:s and it is then left to analysts and Data Engineers to make them possible or to decide that they are not possible with the current state of the data.
A good design principle for the data pipeline is that there is clearly defined plan for the format and structure of the data that remains as constant as possible. Data engineers will make the raw data to flow into analysis layer that has commonly agreed and stable structure. This creates a platform to build analytics efficiently, reducing implementation and maintenance costs.
- Senior Data Scientist with a passion towards data from non-sentient sources